User Journey Reporting in GA4
Funnel explorations in Google Analytics 4 (GA4) are a great way to visualise and analyse user journeys through multiple stages of a website. This data helps you improve your funnels to make them more catered to your customers and identify customer journey issues when they arise leading to increased conversions.
By understanding how users move through different stages of your conversion process, it can help you identify bottlenecks, such as high drop-off rates or prolonged durations at specific steps. Additionally, it allows you to evaluate whether the layout and overall look of the website is too complex, causing confusion or difficulties for users, or if they are not engaging enough to capture and maintain user interest.
In this guide, we will provide you with a step-by-step process to create a funnel exploration. Additionally, we will explain the significance and implications of each available option.

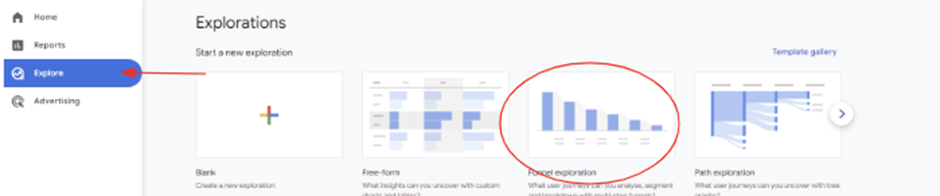
First things first, log into GA4 and click the explore button on the left side menu, you then want to start a new funnel exploration therefore click on the funnel template.
You will need to think about the type of funnel you want to visualise and analyse. If your website focuses on transactions, it could represent the journey of a user making a purchase, or it could be a funnel that maps users from a home page to a certain product page, blog, or thank-you page of a form.
For this guide we’ll be using this particular journey:
Home page -> contact us page -> Confirmation page of contact form
[start_membership]
Once you click into the funnel exploration it will come up with an already-made graph which should look something like this-
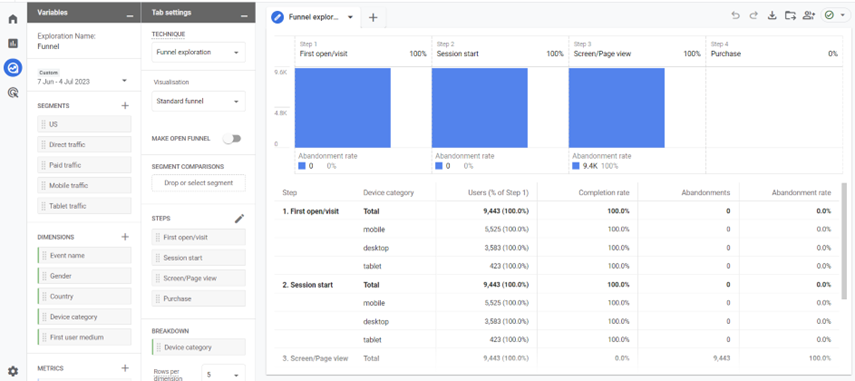
On the far left side you have a variables column and on the right side you have the tab settings column, we will go through what each column means in more detail.
Variables drop down:
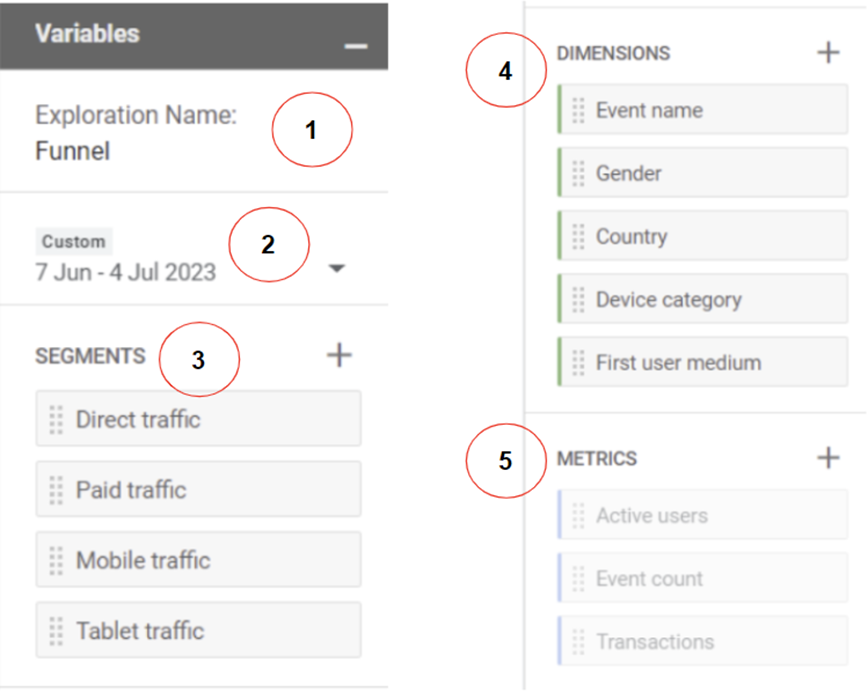
- Exploration name: Name your new exploration report
- Date Range: Select a desired date range – you can also change the date range at any point which can help when comparing data
- Segments: Subsets of users, you can compare different sets of users by dragging a segment into the “segment comparison” section on the “tab settings” drop-down (we will go through this later on), to add a segment press the +
- Dimensions: these are the things you want to analyse, you can compare the different dimensions by dragging them into the “breakdown” section on the “tab settings” drop-down (we will go through this later on), to add a new dimension press the +
- Metrics: Provide the numbers in your exploration, you can add these metrics to the “values” area under the “tab settings” drop down.
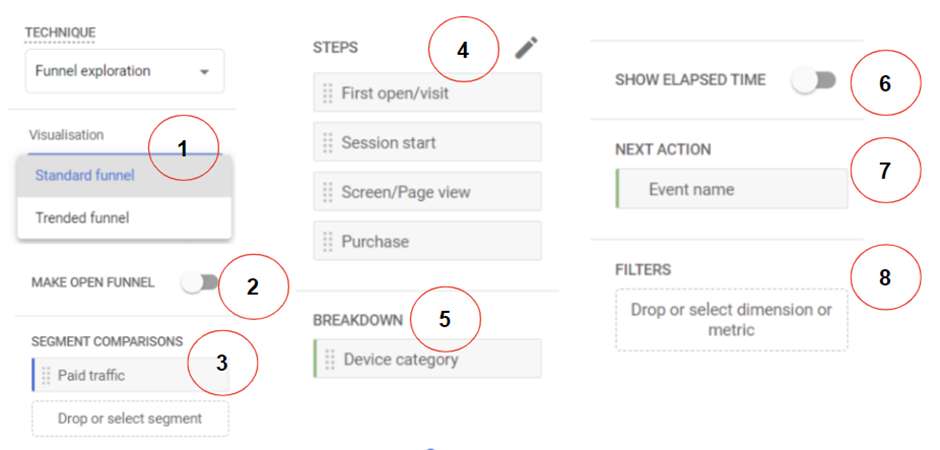
Tab settings drop-down:
- Visualisation: Allows you to display data within different formats eg. pie charts, and bar charts. For funnel exploration, there are two types of funnels which it can display the information (we will show you what these two graphs look like displaying the data later on)
- Make open funnel toggle: User journeys are often flexible, allowing users to enter the process at any point between A and Z. If desired, you can explore how users progress through the funnel assuming it was closed by toggling the option. By selecting this option, the data presented will be adjusted accordingly based on your choice. In the example we are currently examining, we will keep this funnel open.
- Segment comparisons: You can drop “segments” in this option to compare them.
- Steps: Where you add steps of your desired user journey.
- Breakdown: You can add “dimensions” to this section to compare.
- Show elapsed time toggle: Useful if you want to see the average time elapsed between funnel steps.
- Next action: Allows you to see what most common actions users are performing besides moving to the next step in the funnel.
- Filters: Allows you to focus on specific data, you can filter on metrics and dimensions.
Tutorial:
1. The first thing we want to do is create funnel steps. To do this go onto the steps option under the “tab setting” drop-down and click the +
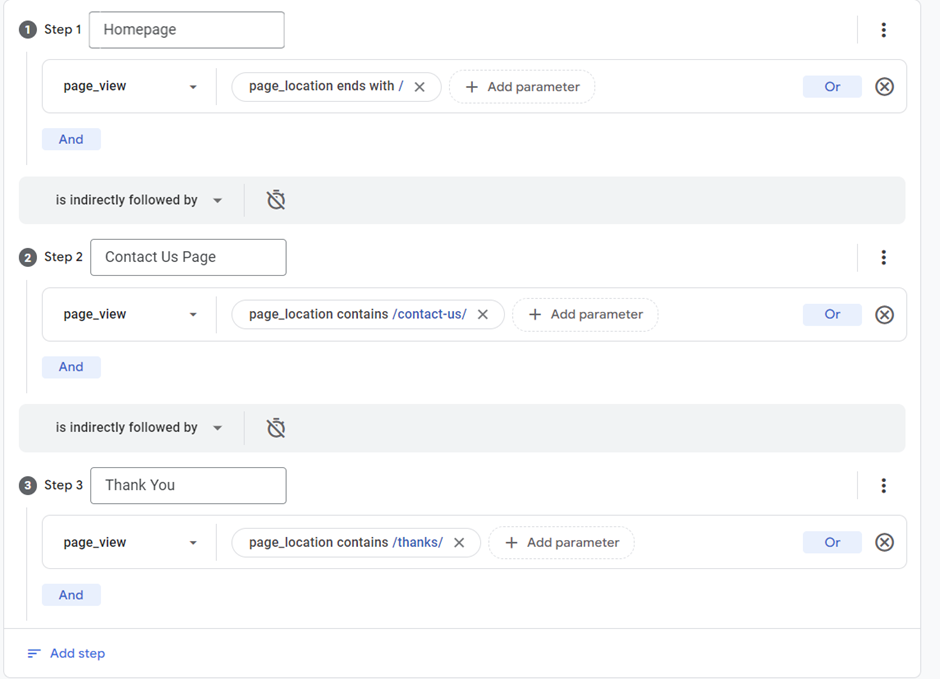
As a reminder, the journey we are following in this funnel is:
Home page -> contact us page -> Confirmation page of contact form
Therefore we want to name this first step Homepage
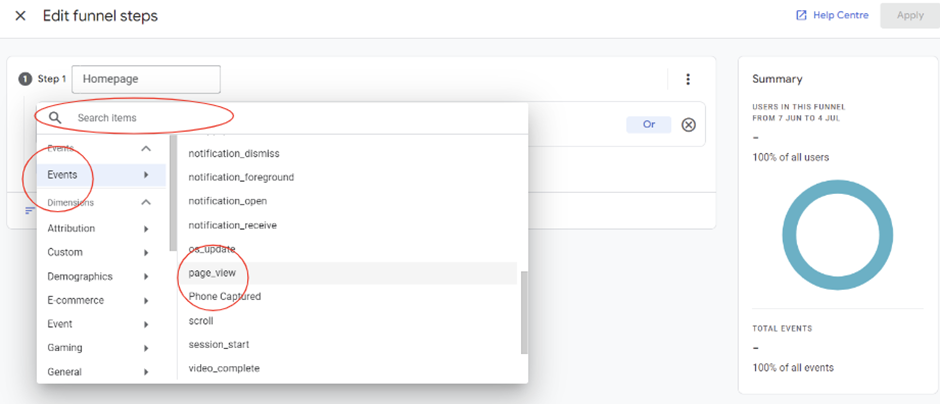
2. We then want to click on the “add new condition” and select Events -> page_view
(if you are unable to locate this you can type it in the search bar.)
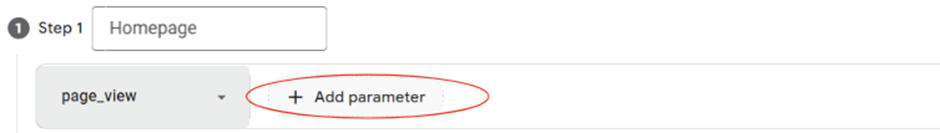
3. Once you have that you then want to click onto the add parameter button
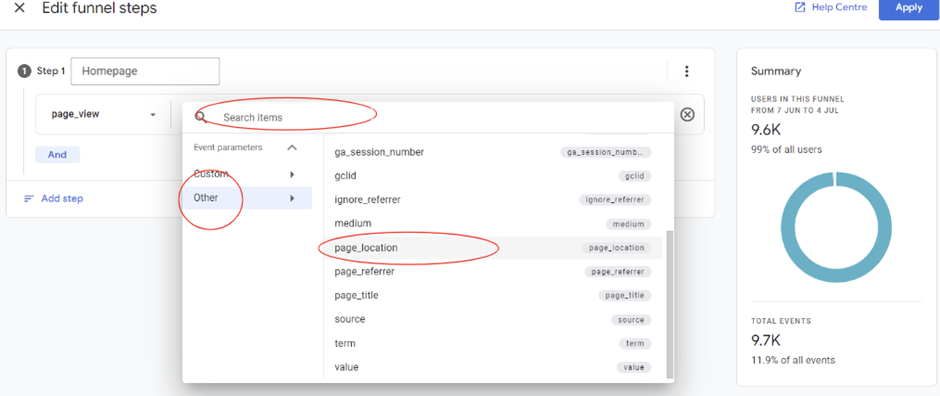
4. You then want to select Other -> page_location (you can search for this in the top bar if you are struggling to locate it)
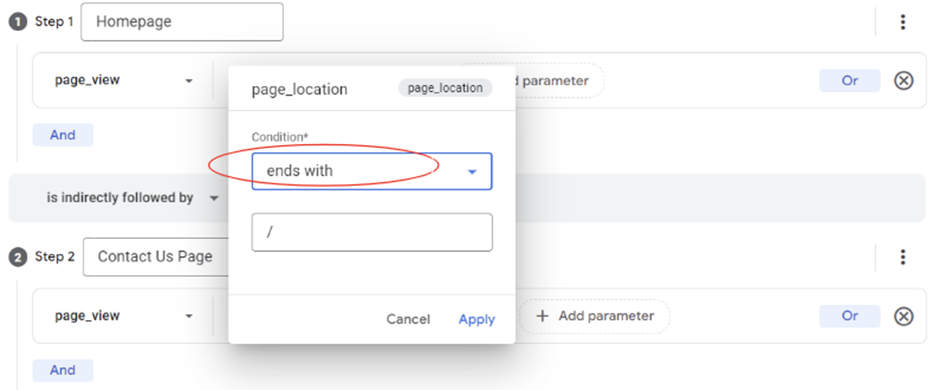
5. You will then need to input what page you want to gather the data from – for our example we are starting with the home page, ensure you select the condition “ends with”
There are several buttons when creating the steps:
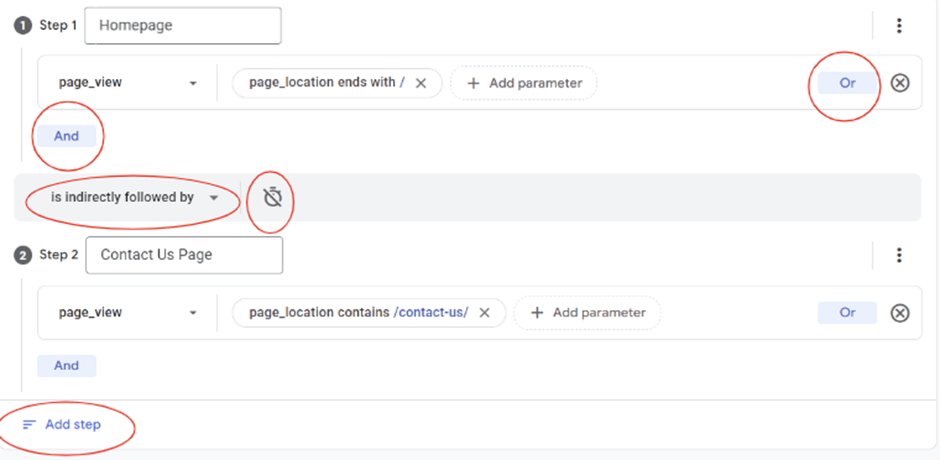
- You have the option to create and/or conditions for a specific step
- You can select whether the step is indirectly followed by or directly followed by, if your funnel needs to follow a particular order and users can’t go back or elsewhere then you should select the “is directly followed by” option however In this instance “indirectly followed by” is appropriate.
- The timer icon allows you to create a time constraint between the steps, if the user journey is time sensitive then toggle this option.
6 . You then want to repeat the first few steps for each stage of your journey. Once completed select “apply” in the top right corner.
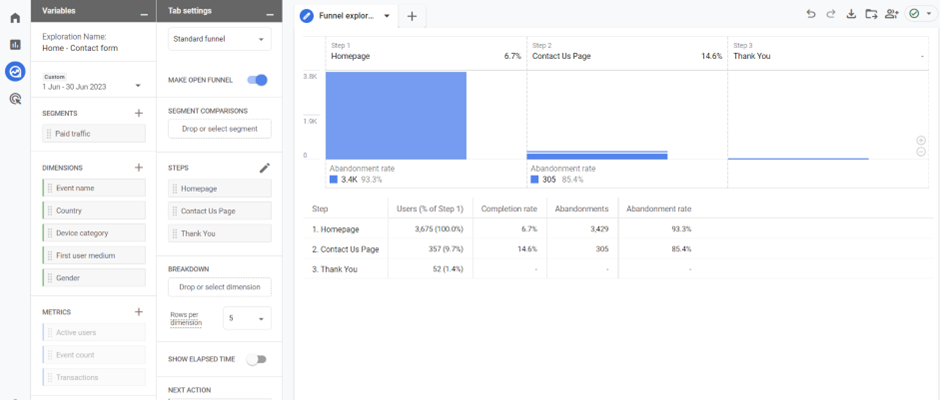
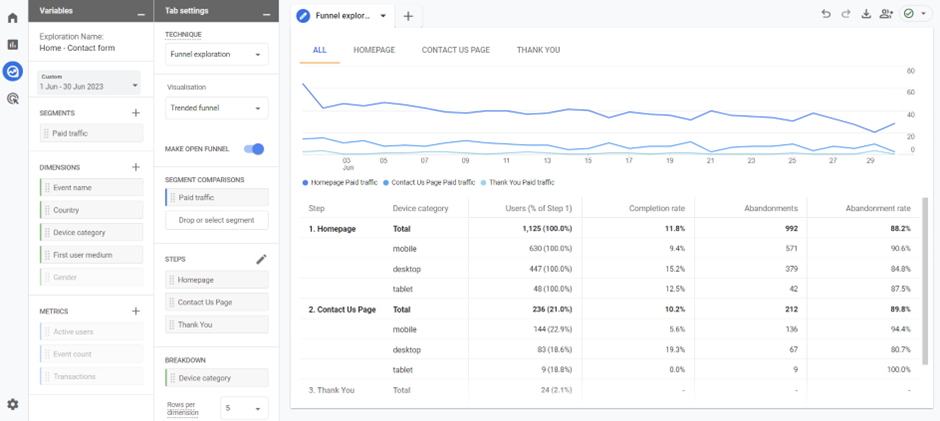
7. It will then take you to your funnel. The data is quite easy to understand, as you can see our example is showing the completion and abandonment rate for each step.
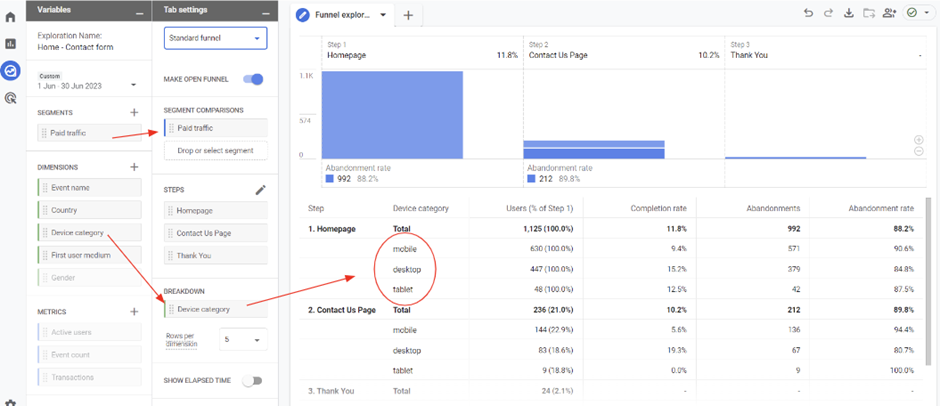
8.To add additional insights the “segment comparisons” and “breakdown” options are highly useful in analysing particular things.
At any point when creating your exploration you can change the visualisation, for example here is the same data but in a trended funnel.
Additionally, If you right click it will bring up more options
You will have the option to “create segments from users” This allows you to create segments to use elsewhere in Google Analytics 4, however, you can only create these segments when the funnel is closed.
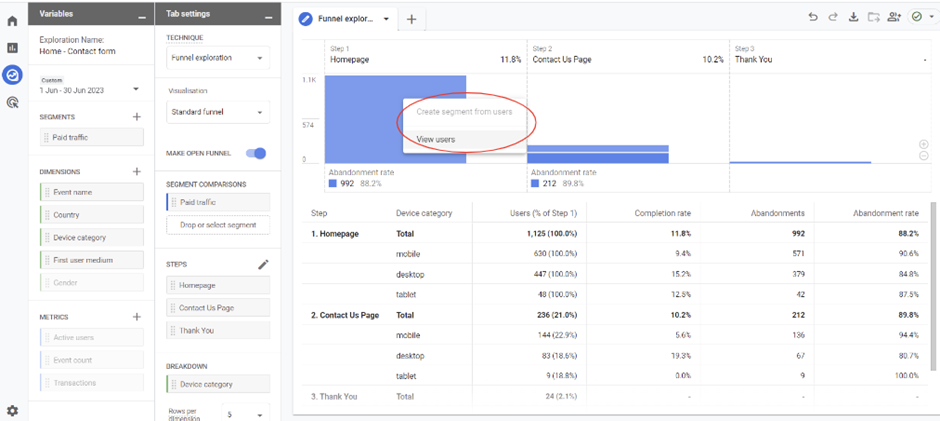
You also have the ability to view users for each step of the funnel. By clicking on that option, a user exploration report will open in another tab within the same report.
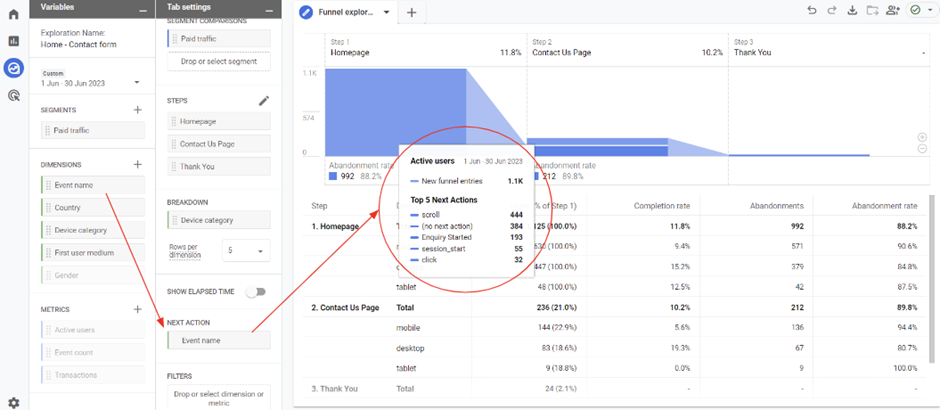
By enabling the “Next Action” option, you can access data on the most common user actions that follow each step of the funnel. This feature provides insights into the typical behaviours exhibited by users after completing each stage, just hover over the bar column to see this additional information.
Funnel explorations offer valuable insights, and there are numerous configurations available to you when creating steps, incorporating breakdowns, and applying filters. These flexible options allow you to customise the analysis based on your specific requirements and extract meaningful information from the data. This data helps you improve your funnels to make them more catered to your customers and identify customer journey issues when they arise.
[end_membership]
What next?
- check out the Lead Demographic Analysis report
- check out the Lead Performance Analysis report
- look at all of our GA4 reporting articles