User Engagement Analysis : GA4 Reporting
In the digital landscape, grasping user engagement is fundamental to optimizing website content and design. With the aid of Google Analytics 4 (GA4), businesses now have access to crucial metrics like time on page, scroll depth, and interaction events. These insightful metrics enable businesses to measure user engagement and pinpoint areas where visitors show the most interest or disinterest.
By leveraging this data, organizations can make informed decisions to enhance user experiences and elevate overall website performance. In this article, we will delve into the significance of GA4’s user engagement metrics and their empowering impact on crafting compelling digital experiences for the audience.

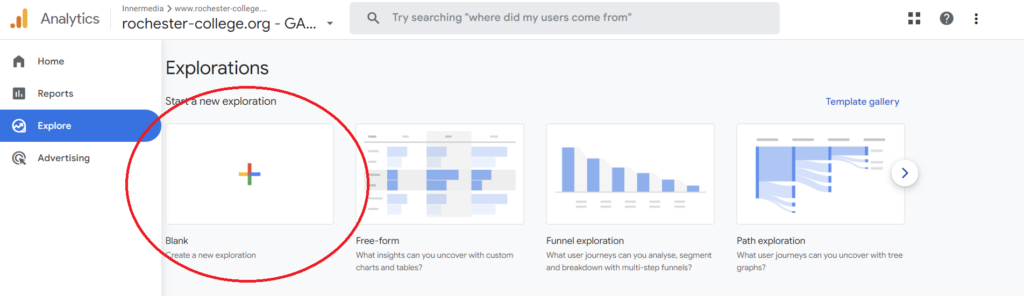
- The first thing you need to do is go to the Google Analytics 4 home page and select “explore” on the left tab. You then want to create a new exploration therefore we are going to select the “blank” Template.
[start_membership]
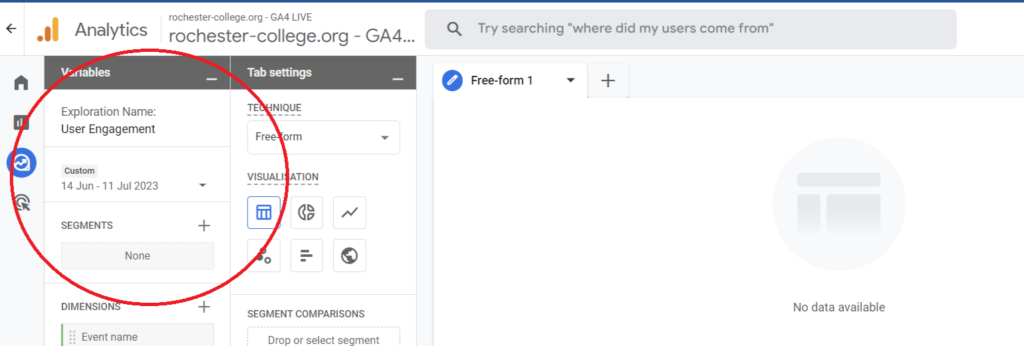
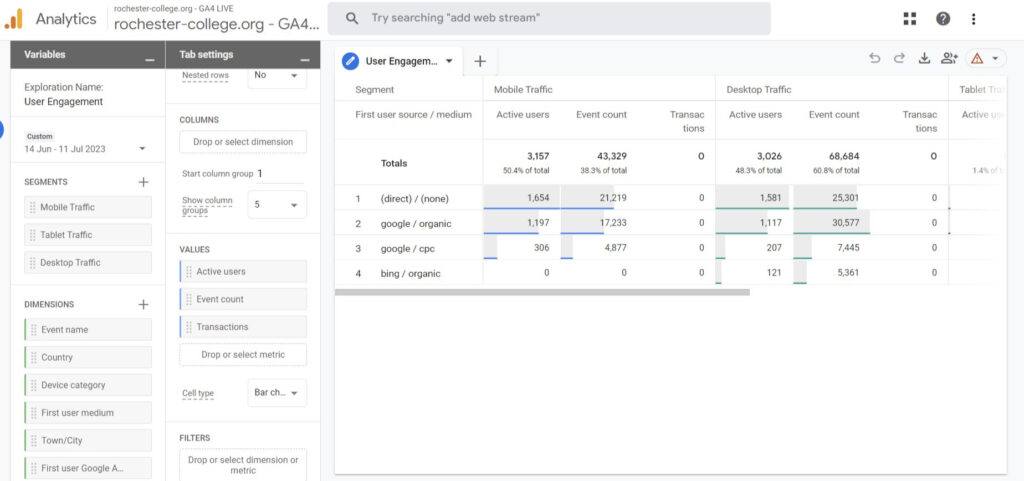
2 . You will then be taken to your blank exploration, the first thing you can do is name your exploration and select a desired date range for your data.
3. For the Segments, You need to click on User Segments then choose to “Platform / Device and then click “Platform/ Device Category”
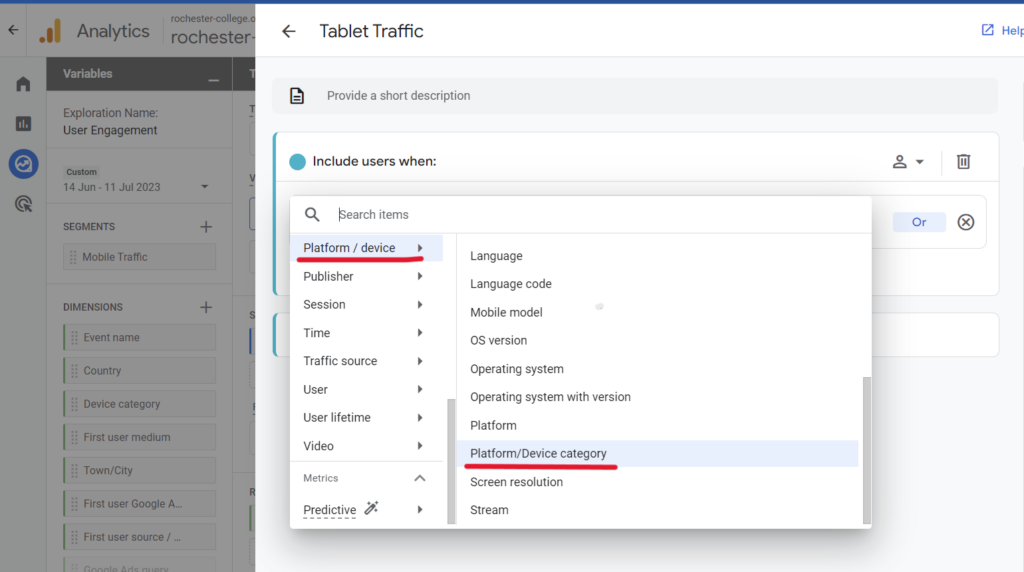
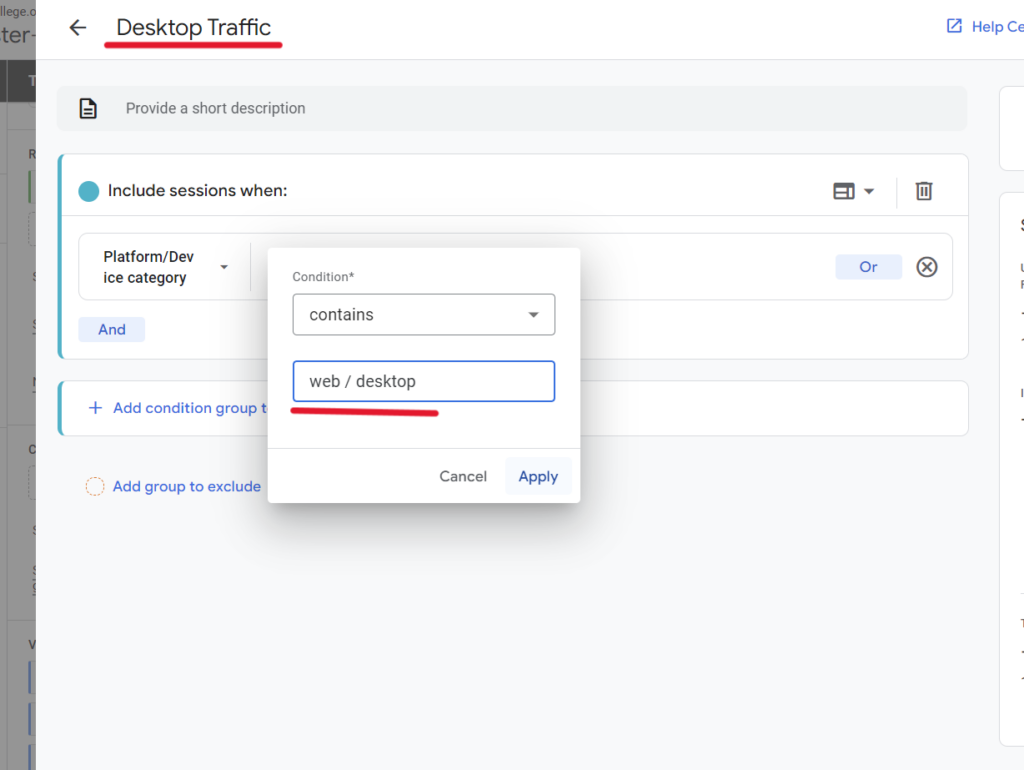
Then, in the categories, you can easily choose the platform you want to add: Desktop, Mobile, or Tablet. Additionally, you should type ‘Desktop Traffic’ into the top as the name than click apply. You can do the same for the rest.
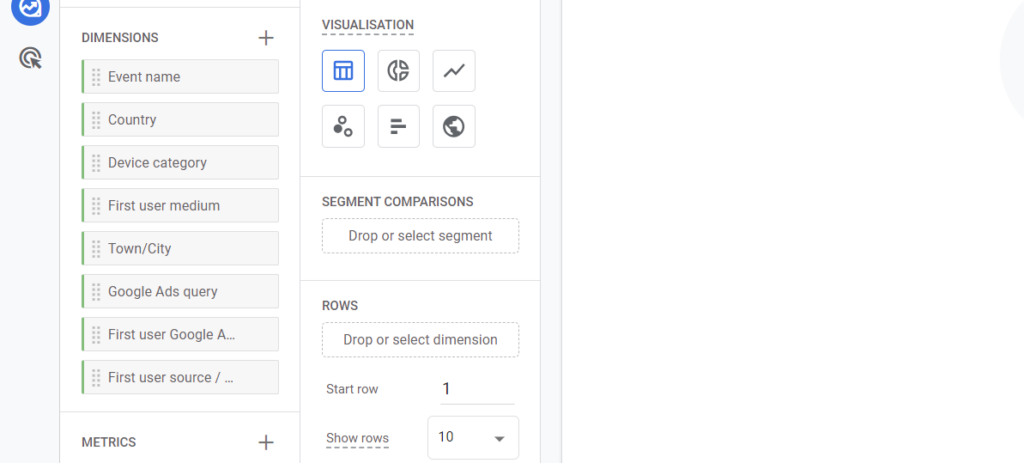
4. Then you can add some dimensions and metrics, select the “+” next to the dimensions column and add these 8 dimensions; “ Event Name, Country, Device Category, First User Medium, Town/City, Google Ads Query, First User Google Ads Keywords, First User Source/ Medium “
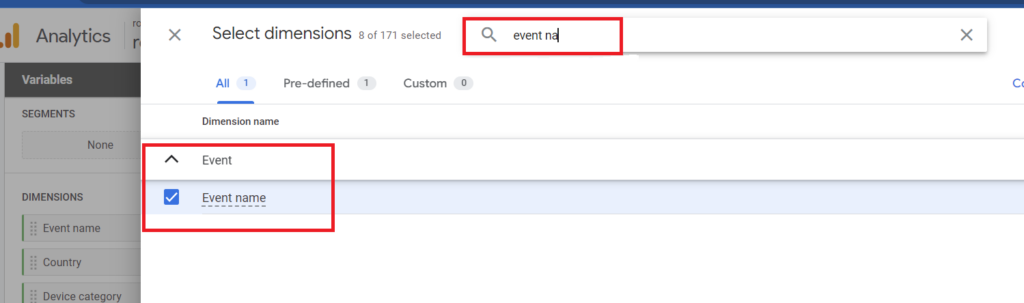
You can easily type in what we want to find into the search button. When you Find it you just need to click the Blue Import button to add them.
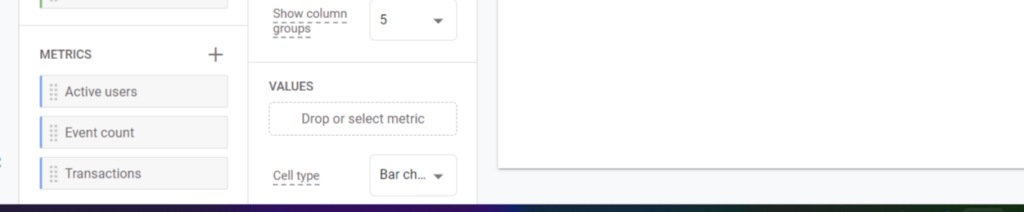
5. You want to add some metrics, select the “+” next to the Metrics column and add these “ Active Users, Event Count and Transactions”
6. For the rows, you should simply pull data from dimensions and drop it in the rows. As for User Engagement, you can use ‘First User Medium’
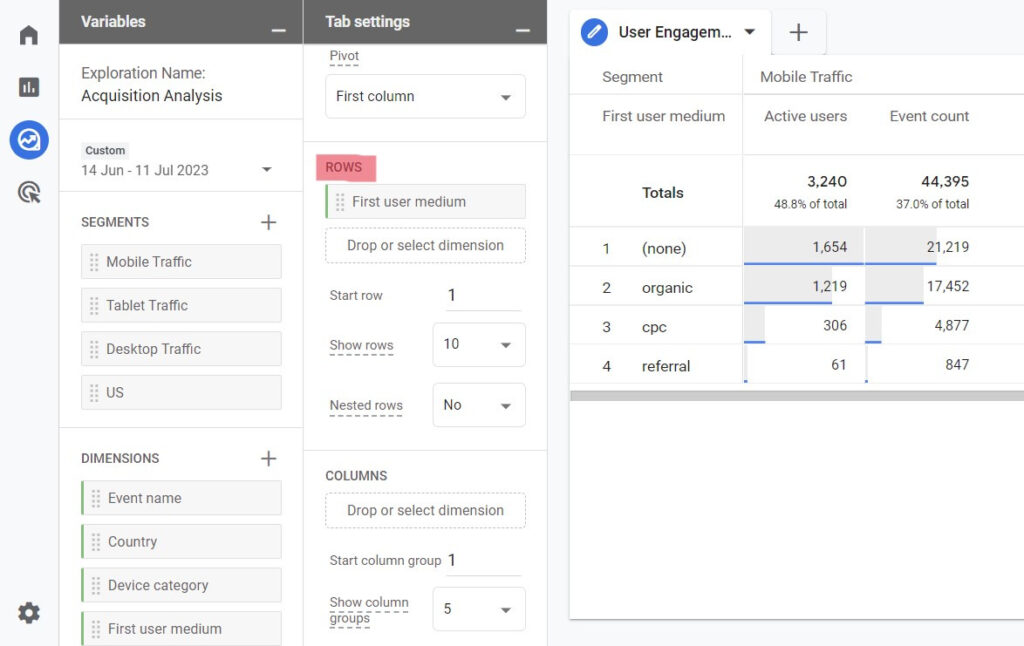
7. You need to follow the same process for Values. You can drop ‘Active Users,’ ‘Event Count,’ and ‘Transactions’ in the Values section.
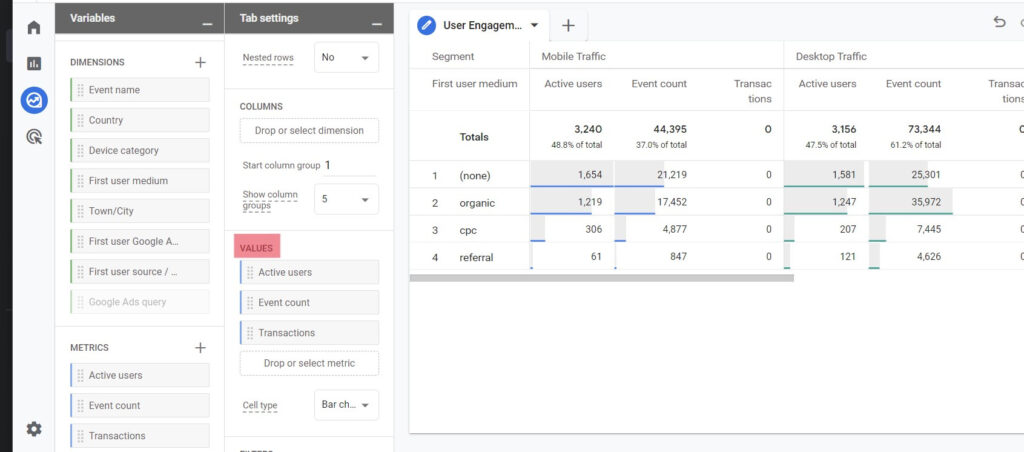
8. At the end of all the steps, you will reach your results.
In conclusion, GA4’s user engagement metrics offer invaluable insights for optimizing website performance. By understanding user behaviour through metrics like time on page, scroll depth, and interaction events, businesses can enhance experiences, cater to preferences, and stay competitive in the ever-evolving digital landscape.
Embracing these insights empowers businesses to build strong, lasting relationships with their online audience.
For more Google Analytics 4 reporting articles click here.
[end_membership]
What next?
- Check out the Acquisition Analysis report
- Check out the Cross-Platform Analysis report
- Look at all of our GA4 Reporting articles