Revenue Attribution Modeling by Source / Medium : GA4 Reporting
One of the most important aspects of running a successful business is understanding where your revenue comes from. With the help of Google Analytics 4 (GA4), online businesses can easily track their revenue attribution by source and medium.
In today’s data-driven business world, understanding your revenue attribution can help you make informed decisions. In this article, we will guide you through the step-by-step process of setting up revenue attribution modelling in GA4.

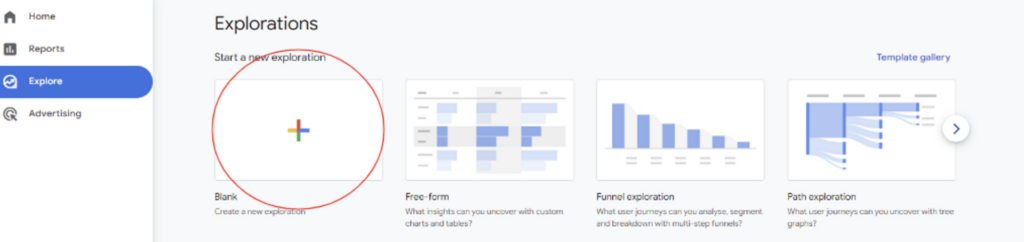
- The first thing you need to do is go onto the left-hand tab in Google Analytics 4 and select “explore”, we then want to create a brand new exploration, therefore, you click on the “blank” template.
[start_membership]
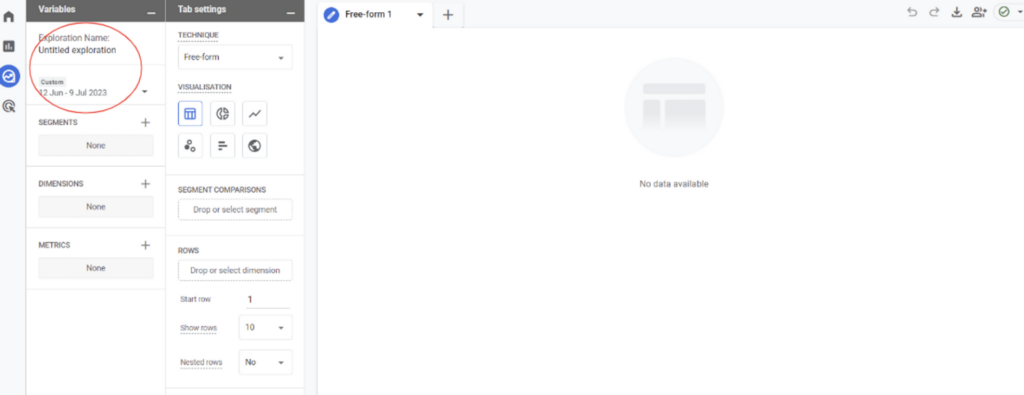
2. You will then be taken to your blank exploration, give this exploration a name and set a desired date range in the “variables” drop-down tab.
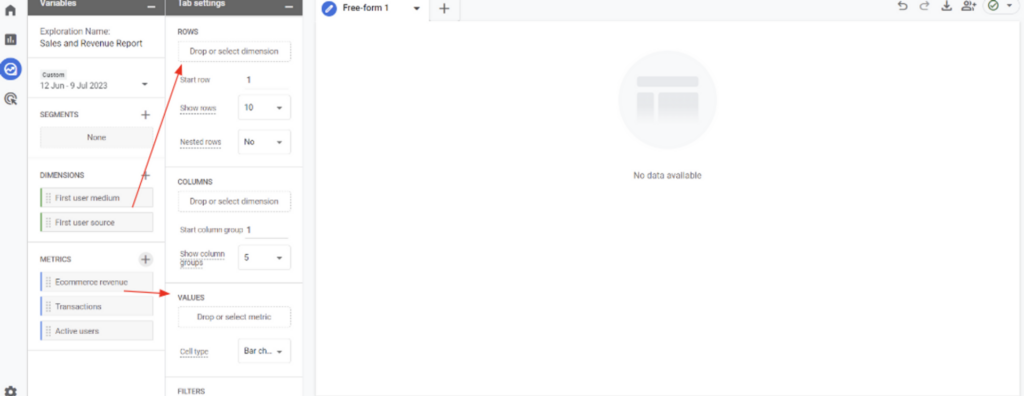
3. We need to start then adding in some segments, dimensions and metrics to the left “variables” drop-down bar. The first thing you want to do is select the “+” next to the “dimensions” column and select traffic source -> “first user medium” and “first user source”
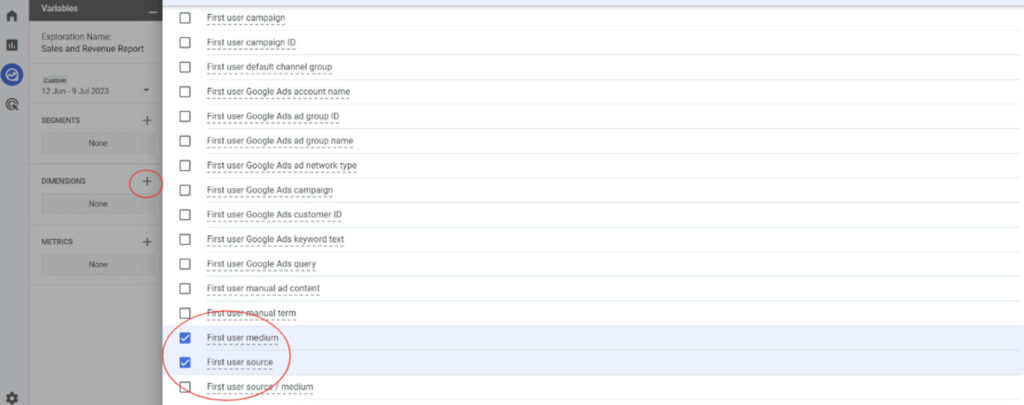
If you can seem to find these options you can also use the search bar at the top to filter and look. You then want to press the blue “import” button in the top right corner.
4. You then want to select the “+” next to the “metrics” column and select these three things, E-commerce Revenue, Transactions, and Active Users.
E-commerce -> Ecommerce Revenue, TransactionsUser -> Active Users
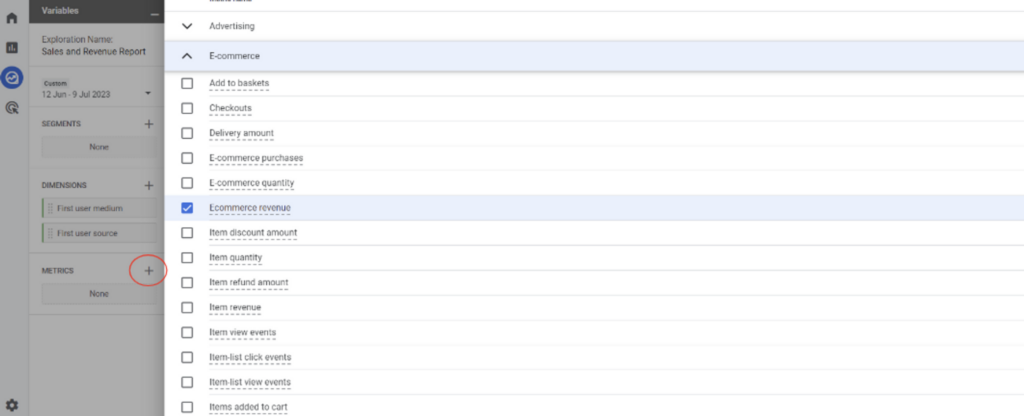
If you fail to find these you can use the search bar at the top. Once you have selected all three press the blue “import” button on the top right.
5. We then want to add these dimensions and metrics into the “rows” and “values” columns found under the tab settings.
6. It will then update to your exploration!
Once your exploration has been created if you choose to update the date range the data will update with it.
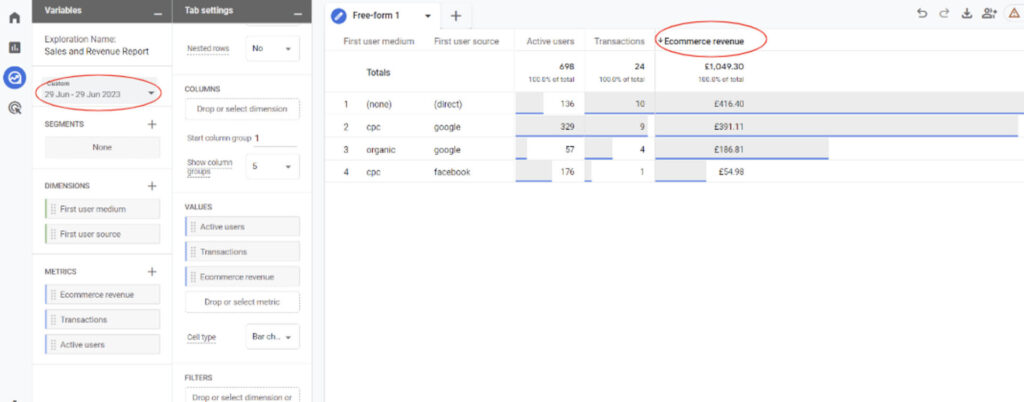
Additionally, you can also press each of the columns to reorder the data from highest to lowest etc.
7. If you scroll to the top of the “tab settings” drop down you can also see there is an option to change the visualisation.
The best way to see the data in a new graph is to click the “+” next to your current exploration to create a new page.
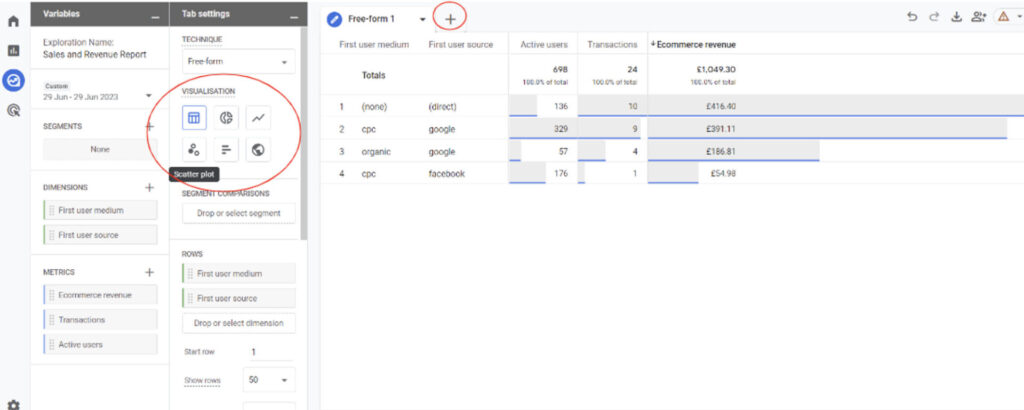
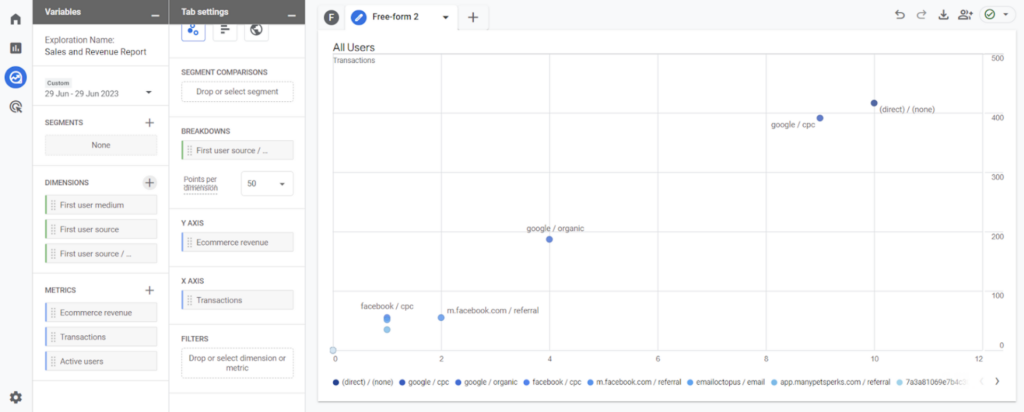
As an example, we are using the scatter plot graph. When creating a new visualisation sometimes you need to alter the way you input the dimensions and metrics. For this one, we have put “E-commerce Revenue” in the Y axis, “Transactions” in the X axis and in the “breakdown” column we have put a new dimension “first user source/medium”
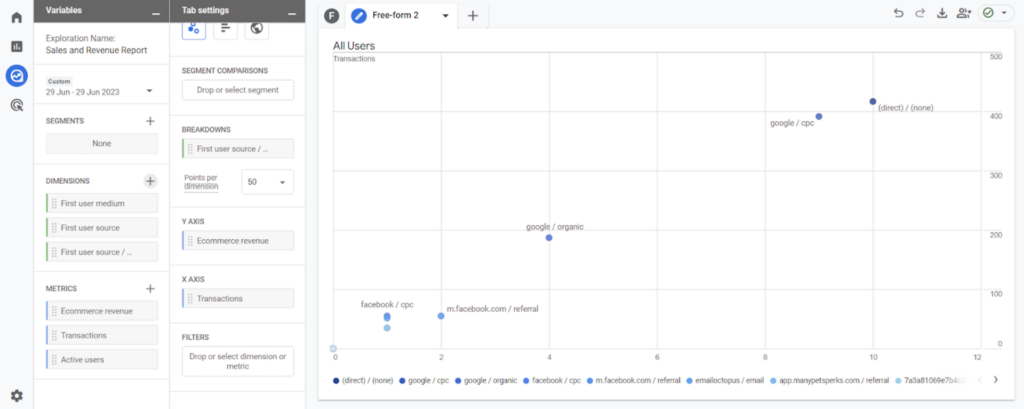
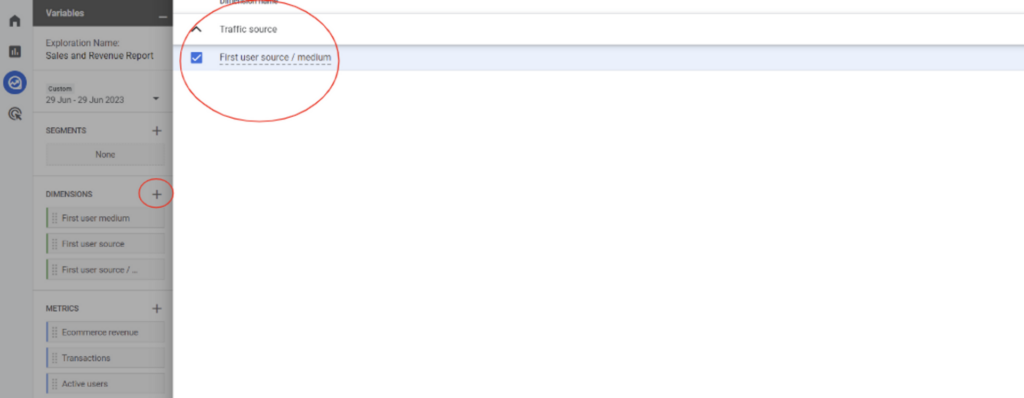
You can find this new dimension by clicking the “+” in the dimensions column going into traffic source -> First user source/medium
If you fail to find it you can use the top bar to search for it.
This will then show the data in an accurate scatter plot graph.
Overall, GA4’s revenue attribution modelling by source and medium is a powerful tool for any online business. Once set up, business owners can gain valuable insights into where their revenue is coming from and understand which marketing strategies are working for them. Hopefully, this article has provided a clear, step-by-step process on how to set up this feature in your GA4 account. With this knowledge, you can optimize your marketing strategies and continue to grow your business.
[end_membership]
What next?
- check out the Shopping Behaviour Analysis report
- check out the Customer Acquisition report
- look at all of our GA4 Reporting articles